7 Management Practices for 300 bu/acre Yields in Corn
Written by Mark Jeschke
S & H Seed Service
Written by Mark Jeschke
Table 1. Locations of NCGA National Corn Yield Contest entries over 300 bu/acre in 2017, 2018, 2019, and 2020.
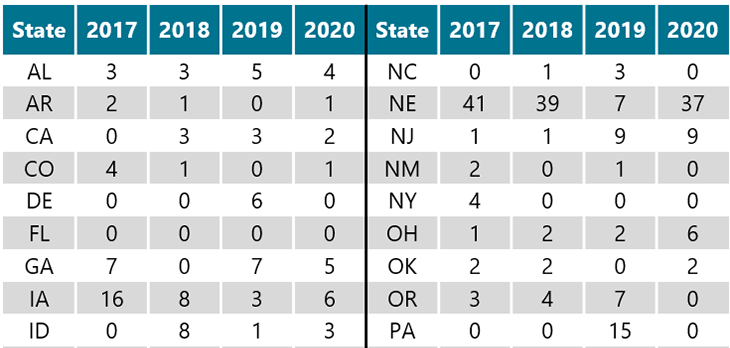
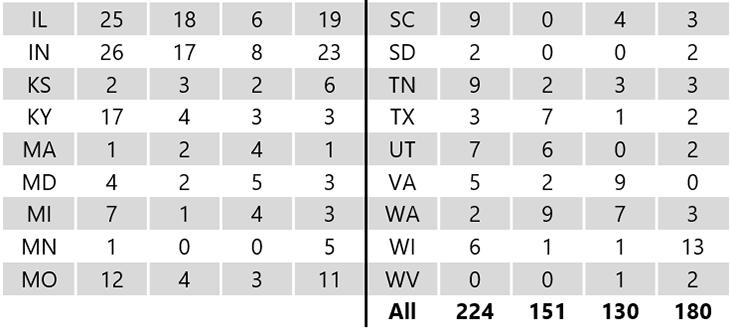
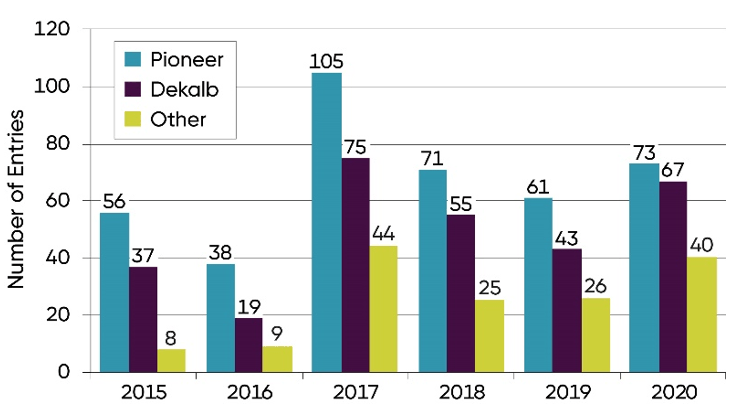
Figure 1. Seed brand planted in NCGA National Corn Yield Contest entries exceeding 300 bu/acre, 2015-2020.
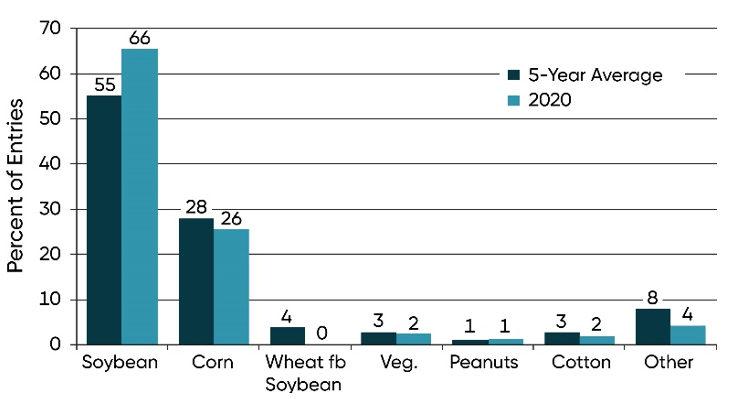
Figure 2. Previous crop in NCGA National Corn Yield Contest entries exceeding 300 bu/acre in 2020 and 5-year averages.
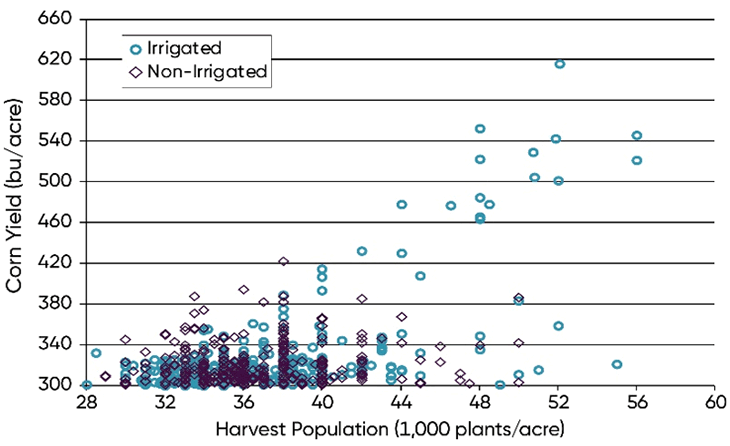
Figure 3. Harvest populations and corn yield NCGA National Corn Yield Contest entries exceeding 300 bu/acre, 2016-2020.
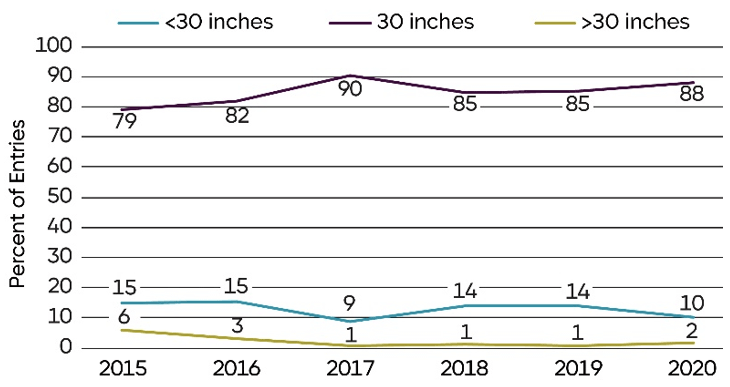
Figure 4. Row spacing used in NCGA National Corn Yield Contest entries exceeding 300 bu/acre, 2015-2020.
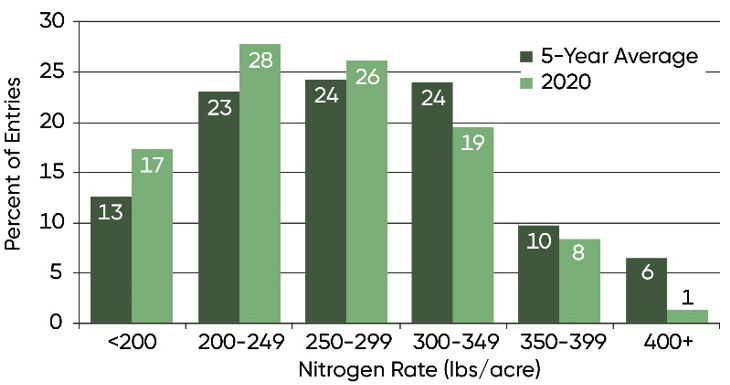
Figure 5. Nitrogen rates (total lbs/acre N applied) of NCGA National Corn Yield Contest entries exceeding 300 bu/acre in 2020 and 5-year averages.
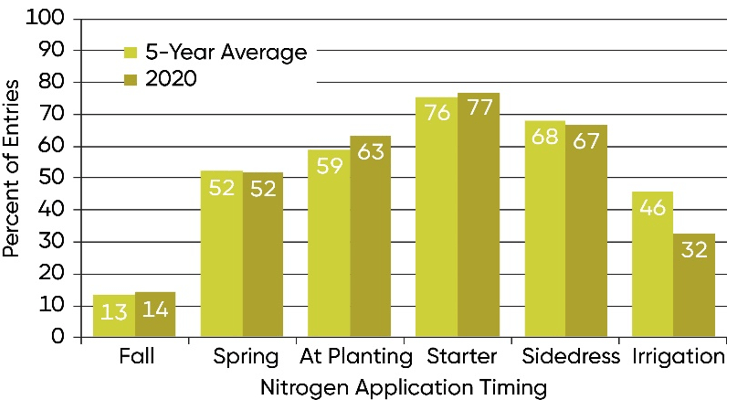
Figure 6. Nitrogen fertilizer application timing of NCGA National Corn Yield Contest entries exceeding 300 bu/acre in 2020 and 5-year averages.
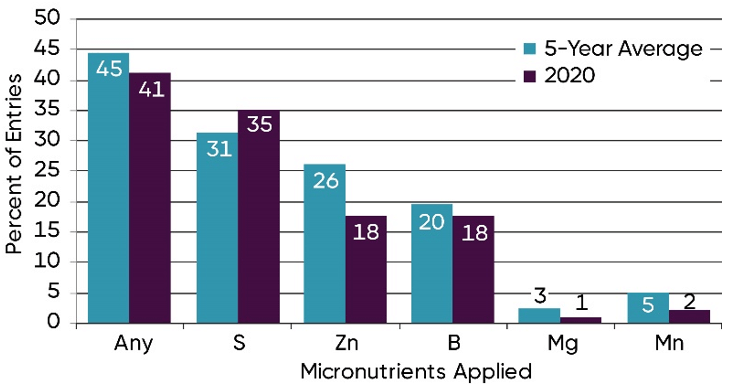
Figure 7. Micronutrients applied in NCGA National Corn Yield Contest entries exceeding 300 bu/acre in 2020 and 5-year averages.
The foregoing is provided for informational use only. Please contact your Pioneer sales professional for information and suggestions specific to your operation. Product performance is variable and depends on many factors such as moisture and heat stress, soil type, management practices and environmental stress as well as disease and pest pressures. Individual results may vary.